 Tracer
Compare
Which vectorizer for which file
If the file is going to a laser, a cutter or a print shop, use Tracer. On ten test images, vtracer's files came out 6.4 times the size of Tracer's and imagetracerjs's 8.6 times, Tracer's results were nearly as close to the original, and with Pro it writes DXF, EPS and PDF. If you want the closest copy of the pixels and file size doesn't matter, imagetracerjs is a little closer on average. We make Tracer, so the images, the method and our sources are below.
Which one for which job
| If you need | Use | Why |
|---|---|---|
| A file for a laser, cutter or CNC | Tracer | A DXF in millimetres with every outline closed, from a one-colour trace. With Pro. |
| A small file that still looks like the image | Tracer | 5.7 MB for all ten images, against 49.1 MB from imagetracerjs and 36.6 MB from vtracer. |
| The closest copy of the pixels | imagetracerjs | A little closer to the original on average, with files 8.6 times the size of Tracer's. |
| A vectorizer inside your own code | vtracer or imagetracerjs | They are libraries you can build in. Tracer is a website, not a library. |
Smaller files, fewer points, fewer outlines
Across the ten images, Tracer's files came to 5.7 MB. vtracer's came to 36.6 MB and imagetracerjs's to 49.1 MB, 6.4 and 8.6 times as much. Tracer's paths had 196,714 points, vtracer's 550,538 and imagetracerjs's 1,916,894. They held 21,545 outlines, against 37,031 from vtracer and 316,482 from imagetracerjs.
The extra size buys almost no closeness. Across the ten images, Tracer's average difference from the original is practically the same as that of the closest tool, imagetracerjs: 2.27% against 2.23%, while imagetracerjs's files are 8.6 times the size of Tracer's.
Every point is something your editor, your cutting software or a print shop's software has to read. Every outline is a separate path a laser or cutter follows.
All ten images together
| Tool | File size | Points on the paths | Outlines |
|---|---|---|---|
| Tracer | 5,837 | 196,714 | 21,545 |
| vtracer | 37,504 | 550,538 | 37,031 |
| imagetracerjs | 50,282 | 1,916,894 | 316,482 |
- SVG file size in kilobytes.
- Segment end points. Fewer points are easier to edit; too few lose the shape.
- The separate paths in each SVG. A shape with a hole counts as two.
Files for machines
Tracer writes SVG for free, and with Pro it writes DXF, EPS and PDF. Its DXF is in millimetres, with the longer side at 100 mm, and every outline in it is closed. From the logo, the text, the technical drawing and the line illustration, the images it traced in one colour, it wrote 11, 71, 328 and 99 closed outlines and no open ones. Curves become straight segments that stay within 0.25 mm of the original. A DXF needs a one-colour trace; a colour trace downloads as SVG, EPS or PDF.
vtracer and imagetracerjs write SVG. In Tracer's, vtracer's and imagetracerjs's SVG, every outline ends with the Z that closes a path.
| SVG | DXF | EPS | ||
|---|---|---|---|---|
| Tracer | Free | With Pro, one-colour traces, millimetres | With Pro | With Pro |
| vtracer | Yes | No | No | No |
| imagetracerjs | Yes | No | No | No |
If your machine software opens SVG, any of the three gives it a file. The difference is how big that file is, and whether you also need DXF, EPS or PDF.
How you use each one
Tracer is a website: open it, drop an image, download the file. With Pro you can trace up to 25 images in one go and get them back as one ZIP.
vtracer has a web demo, apps to install, and a library and command-line program. imagetracerjs is a JavaScript library with a command-line script. They're free, and you can script them to process as many files as you like.
Read these numbers knowing this
- We make Tracer, and we picked the images. We picked them before measuring and changed none after.
- Every tool ran on its default settings. vtracer and imagetracerjs have settings we didn't try, and may do better with them.
- We tested vtracer 0.6.15, the Python package. VTracer 2, its newer app, wasn't part of this.
- Tracer ran on Auto. It traced the logo, the text, the technical drawing and the line illustration in one colour and sent the other six images to its colour engine, which came back with 7 to 12 colours, one layer each.
- Differences of a few hundredths of a point mean little. Drawn in a second renderer (Chromium), the same files moved by as much as 0.70 points.
- We didn't compare speed. Tracer ran through a browser and a server, the others on one computer.
How we measured
Every measurement, image by image and tool by tool, is in one CSV file. The ten images are below.
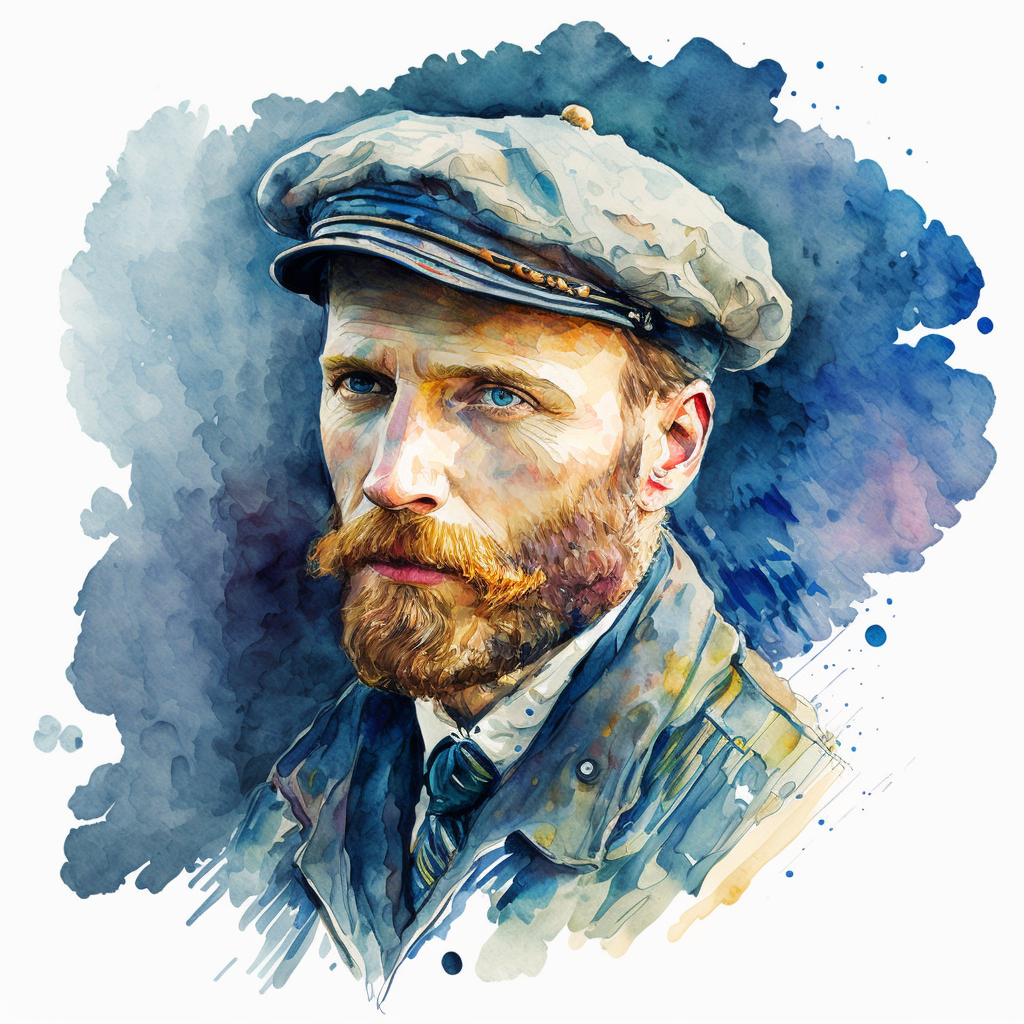
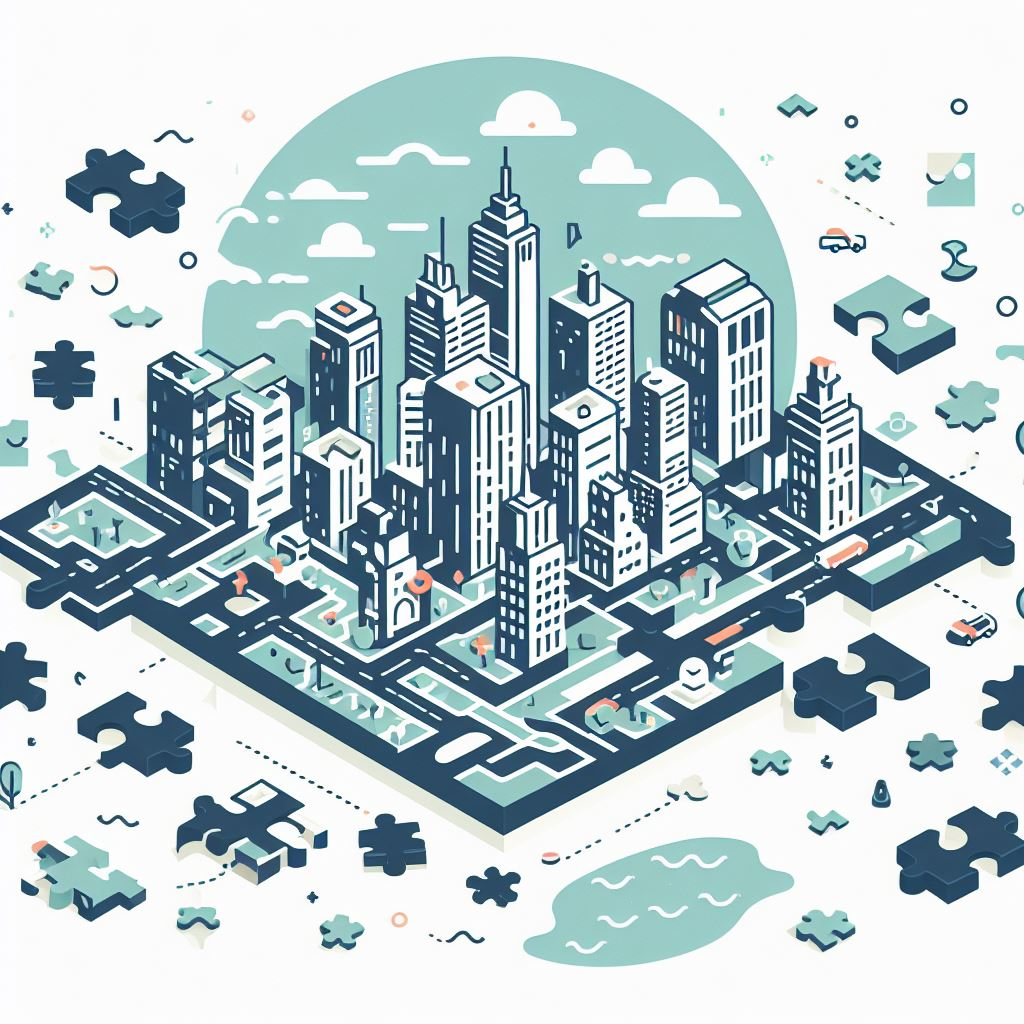
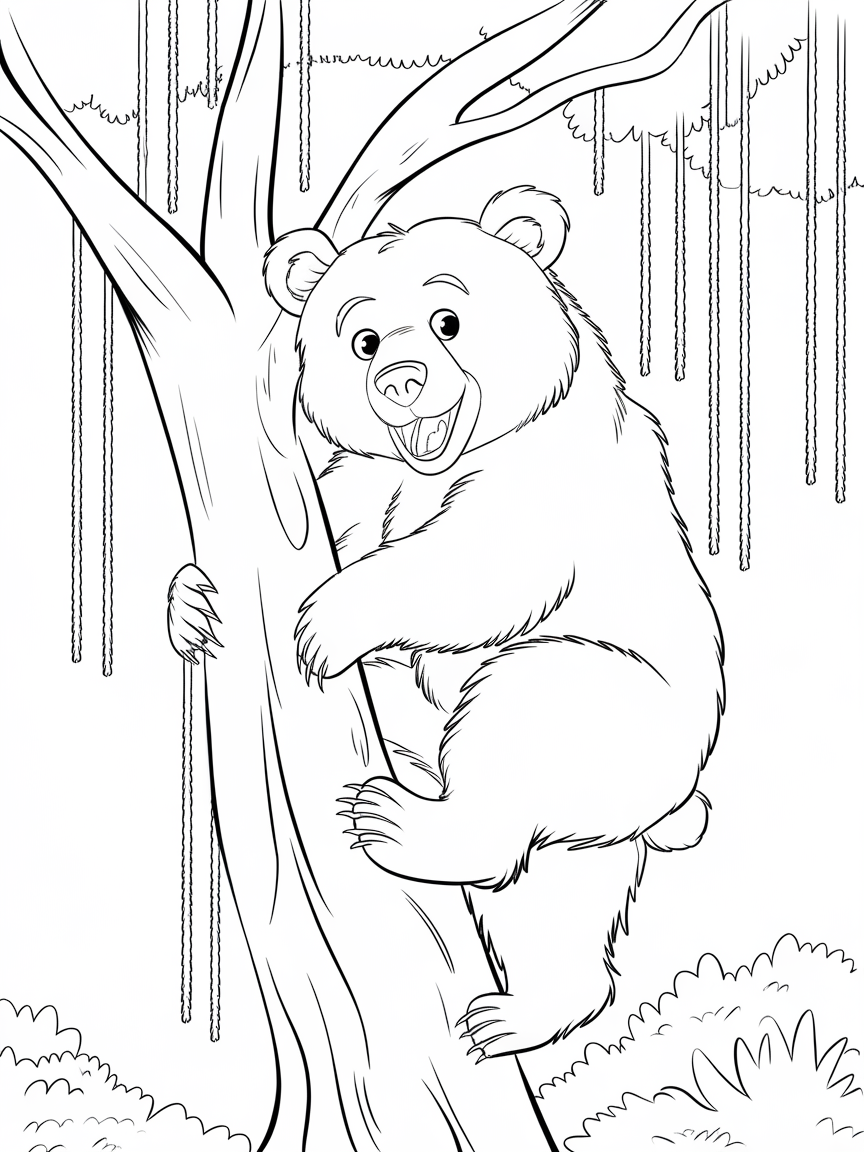
- The ten images below: a logo, a hand-drawn sketch, a photo, a multicolour graphic, text, a technical drawing, an AI portrait, an AI-style city, a scanned sticker and a line illustration. The same file for every tool.
- Every SVG drawn at the image's own size on white by librsvg and compared pixel by pixel with the original: the mean absolute RGB difference, as a percentage of full scale.
- Tracer's colour engine reduces an image to 1200 px on its longer side before tracing, which touched three of the ten. Its SVG is drawn back at the original size like the others.
- Size is the SVG file in kilobytes (1 KB = 1024 bytes). Points are the end points of path segments, the start of each outline included. Outlines are the separate paths; a closed one ends with Z.
- Tracer's colour SVG is the file the app downloads, which closes each outline with Z. The DXF counts come from Tracer's own DXF writer, run on its four one-colour traces.
The ten images
Open any of them and run your own tools on it. Each is the exact file every tool traced: flattened on white, at most 1500 px on its longer side, saved as PNG.
| Image | Made by | Source | Licence |
|---|---|---|---|
| Logo | Tracer, our logo | Made for this test | Ours. Use it to repeat this test. |
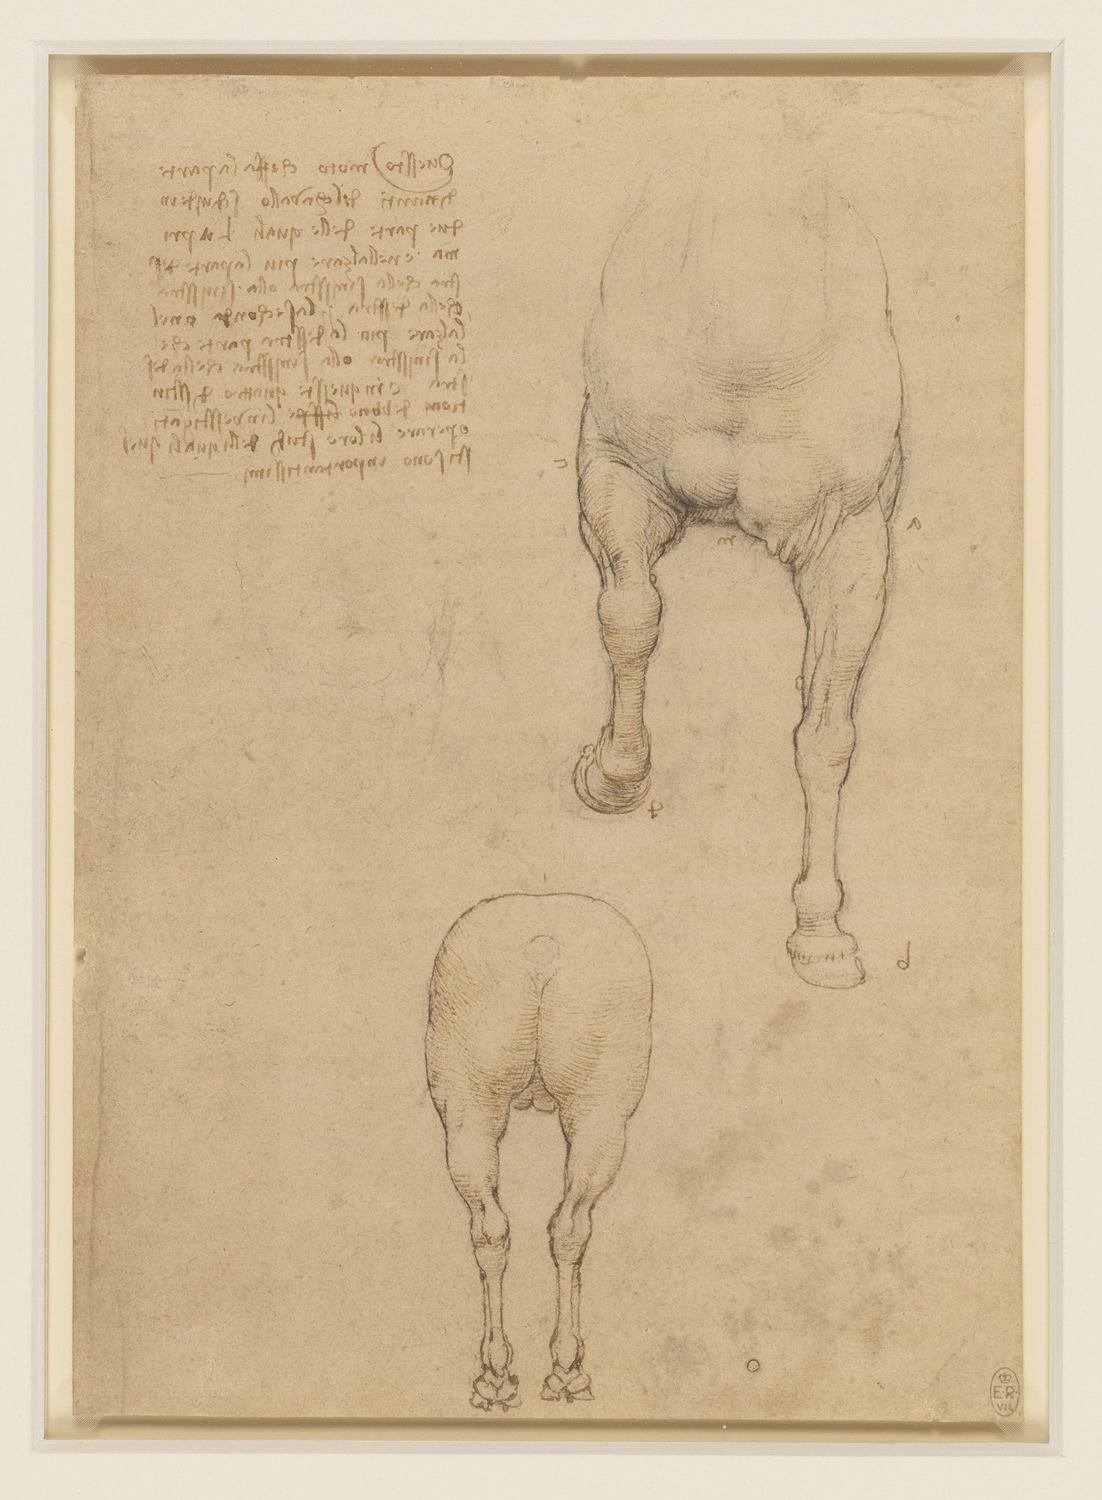
| Hand-drawn sketch | Leonardo da Vinci, “Studies of a horse”, about 1517–18, Royal Collection | On Wikimedia Commons | Public domain |
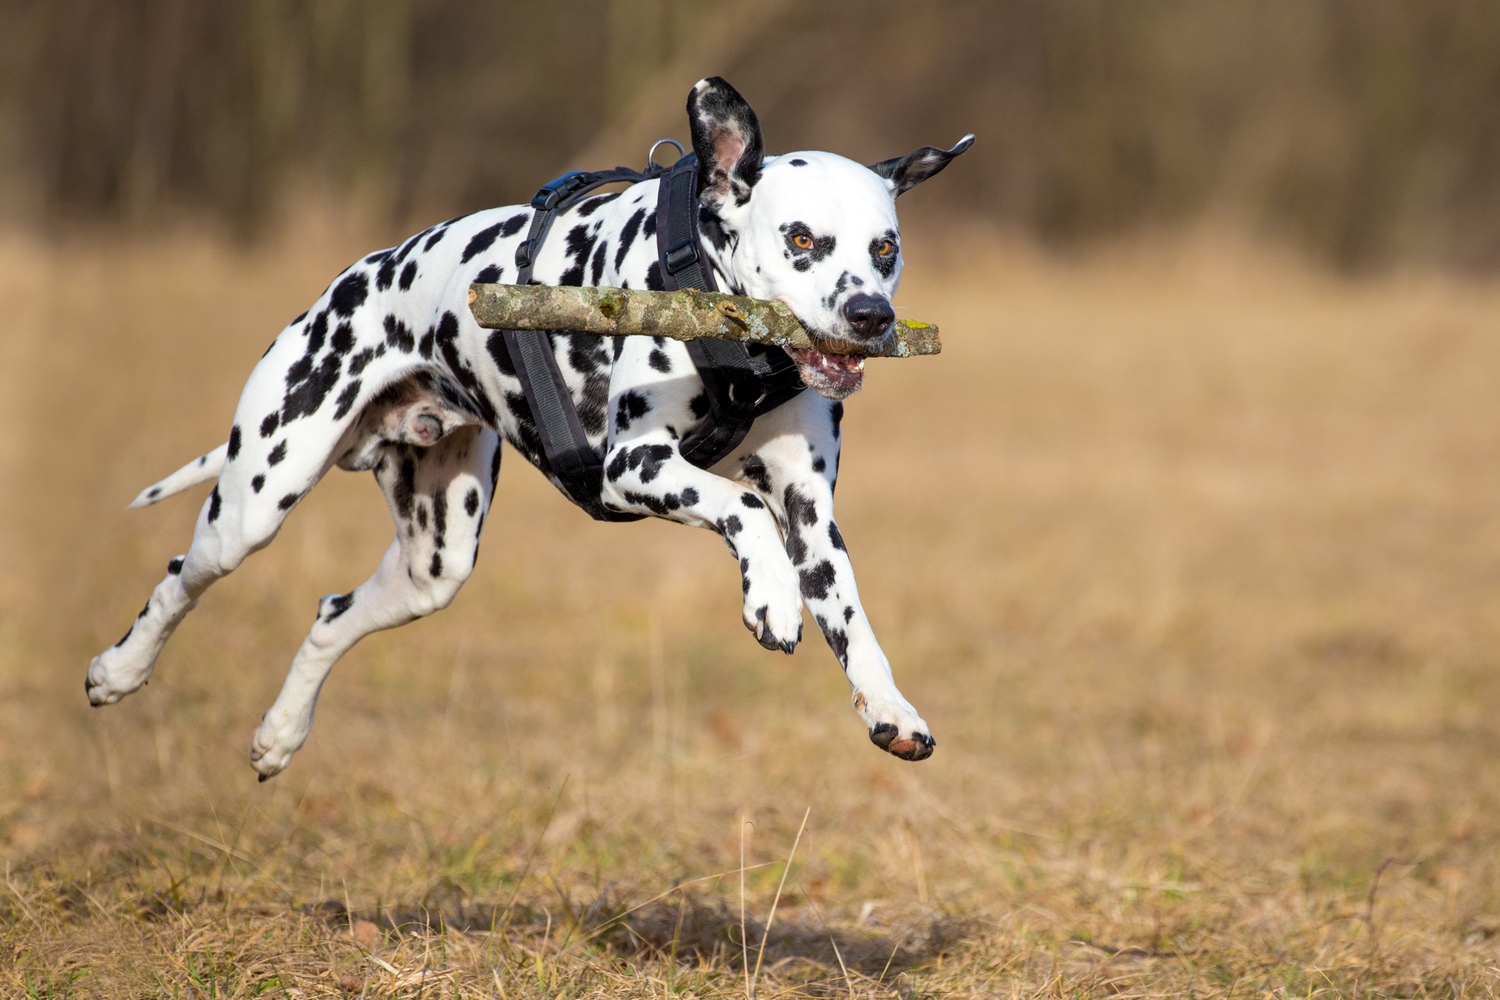
| Photo | Lucasbosch, “Dalmatian fetching a stick” | On Wikimedia Commons | CC BY-SA 4.0. Our copy is smaller and saved as PNG, under the same licence. |
| Multicolour graphic | Google, Noto Emoji astronaut | On GitHub | Apache License 2.0. Drawn at 1500 px and saved as PNG. |
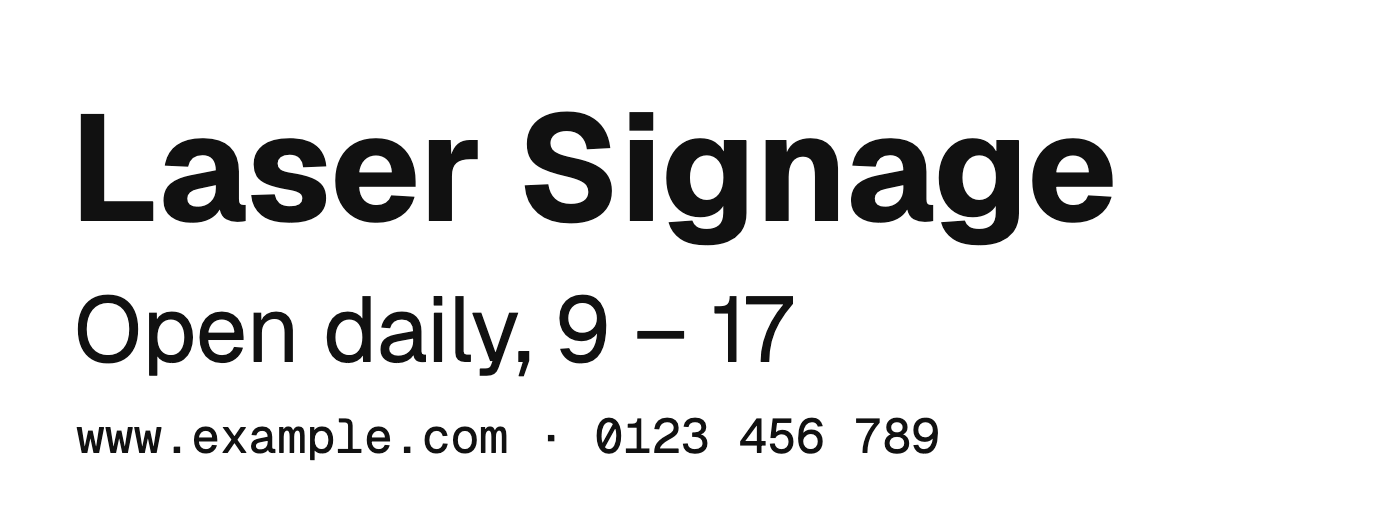
| Text | Tracer, set in Geist | Made for this test | Ours. Free to use. |
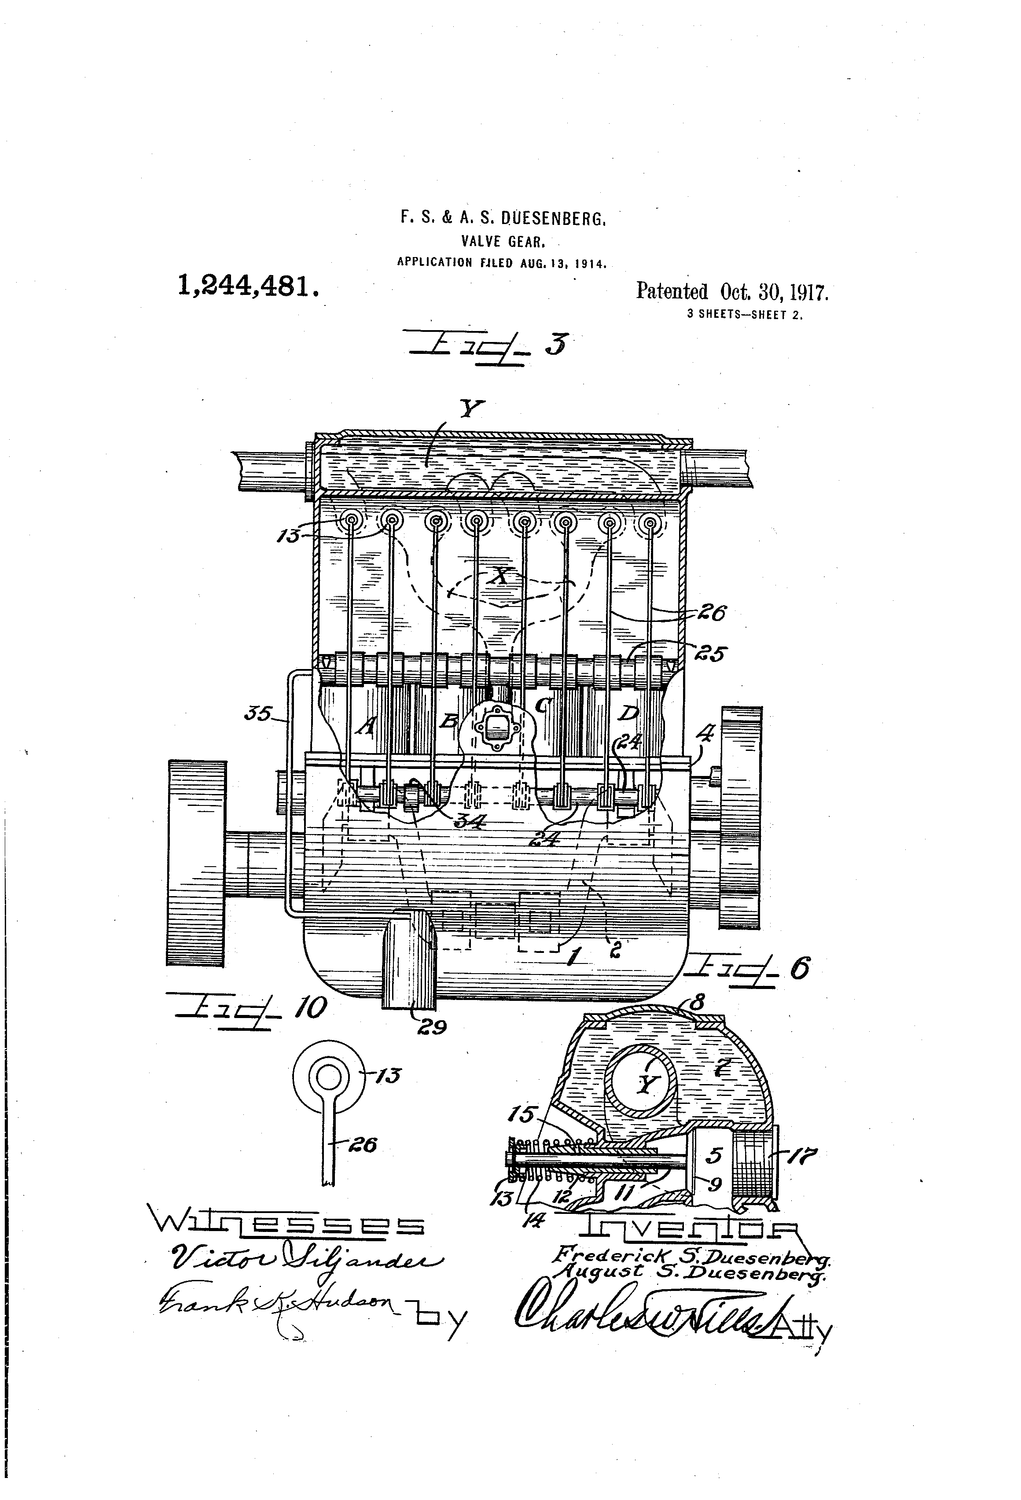
| Technical drawing | F. S. and A. S. Duesenberg, US patent 1,244,481, “Valve gear”, figure 1 | On Wikimedia Commons | Public domain |
| AI portrait | Midjourney, prompted by Netha Hussain, “Vincent van Gogh in watercolour” | On Wikimedia Commons | Public domain |
| AI-style city | DALL·E, prompted by Lea Lacroix (WMDE), “Puzzle representing a city” | On Wikimedia Commons | Public domain |
| Scanned sticker | A 1961 Allentown Jets booster sticker, scanned | On Wikimedia Commons | Public domain |
| Line illustration | Sumbrella45, “Brown bear coloring page” | On Wikimedia Commons | CC0, no rights reserved |











Where each number comes from
| Tool | Version | How it ran |
|---|---|---|
| Tracer | www.imagetracer.app, 3 November 2026 | On the website, no account, preset Auto |
| vtracer | 0.6.15 on PyPI | The Python package with its defaults, on our computer |
| imagetracerjs | 1.2.6 on npm | Its “default” preset, on our computer |
What each tool writes comes from its own documentation: the vtracer README, the VTracer Web Demo page and the imagetracerjs README.
Try it on your file
You know what to look for.
Now check your own image.
Upload it and compare the vector with the original before you download anything. SVG export is free.